What is data visualization?
Data visualization refers to the techniques involved in graphically representing data, using visual elements like charts and graphs to spot trends, patterns, and outliers, for quick insights, and to help in real-time decision-making. It's increasingly important in today's world to understand the overwhelming volume of data being generated by businesses every single day.
Sign up for free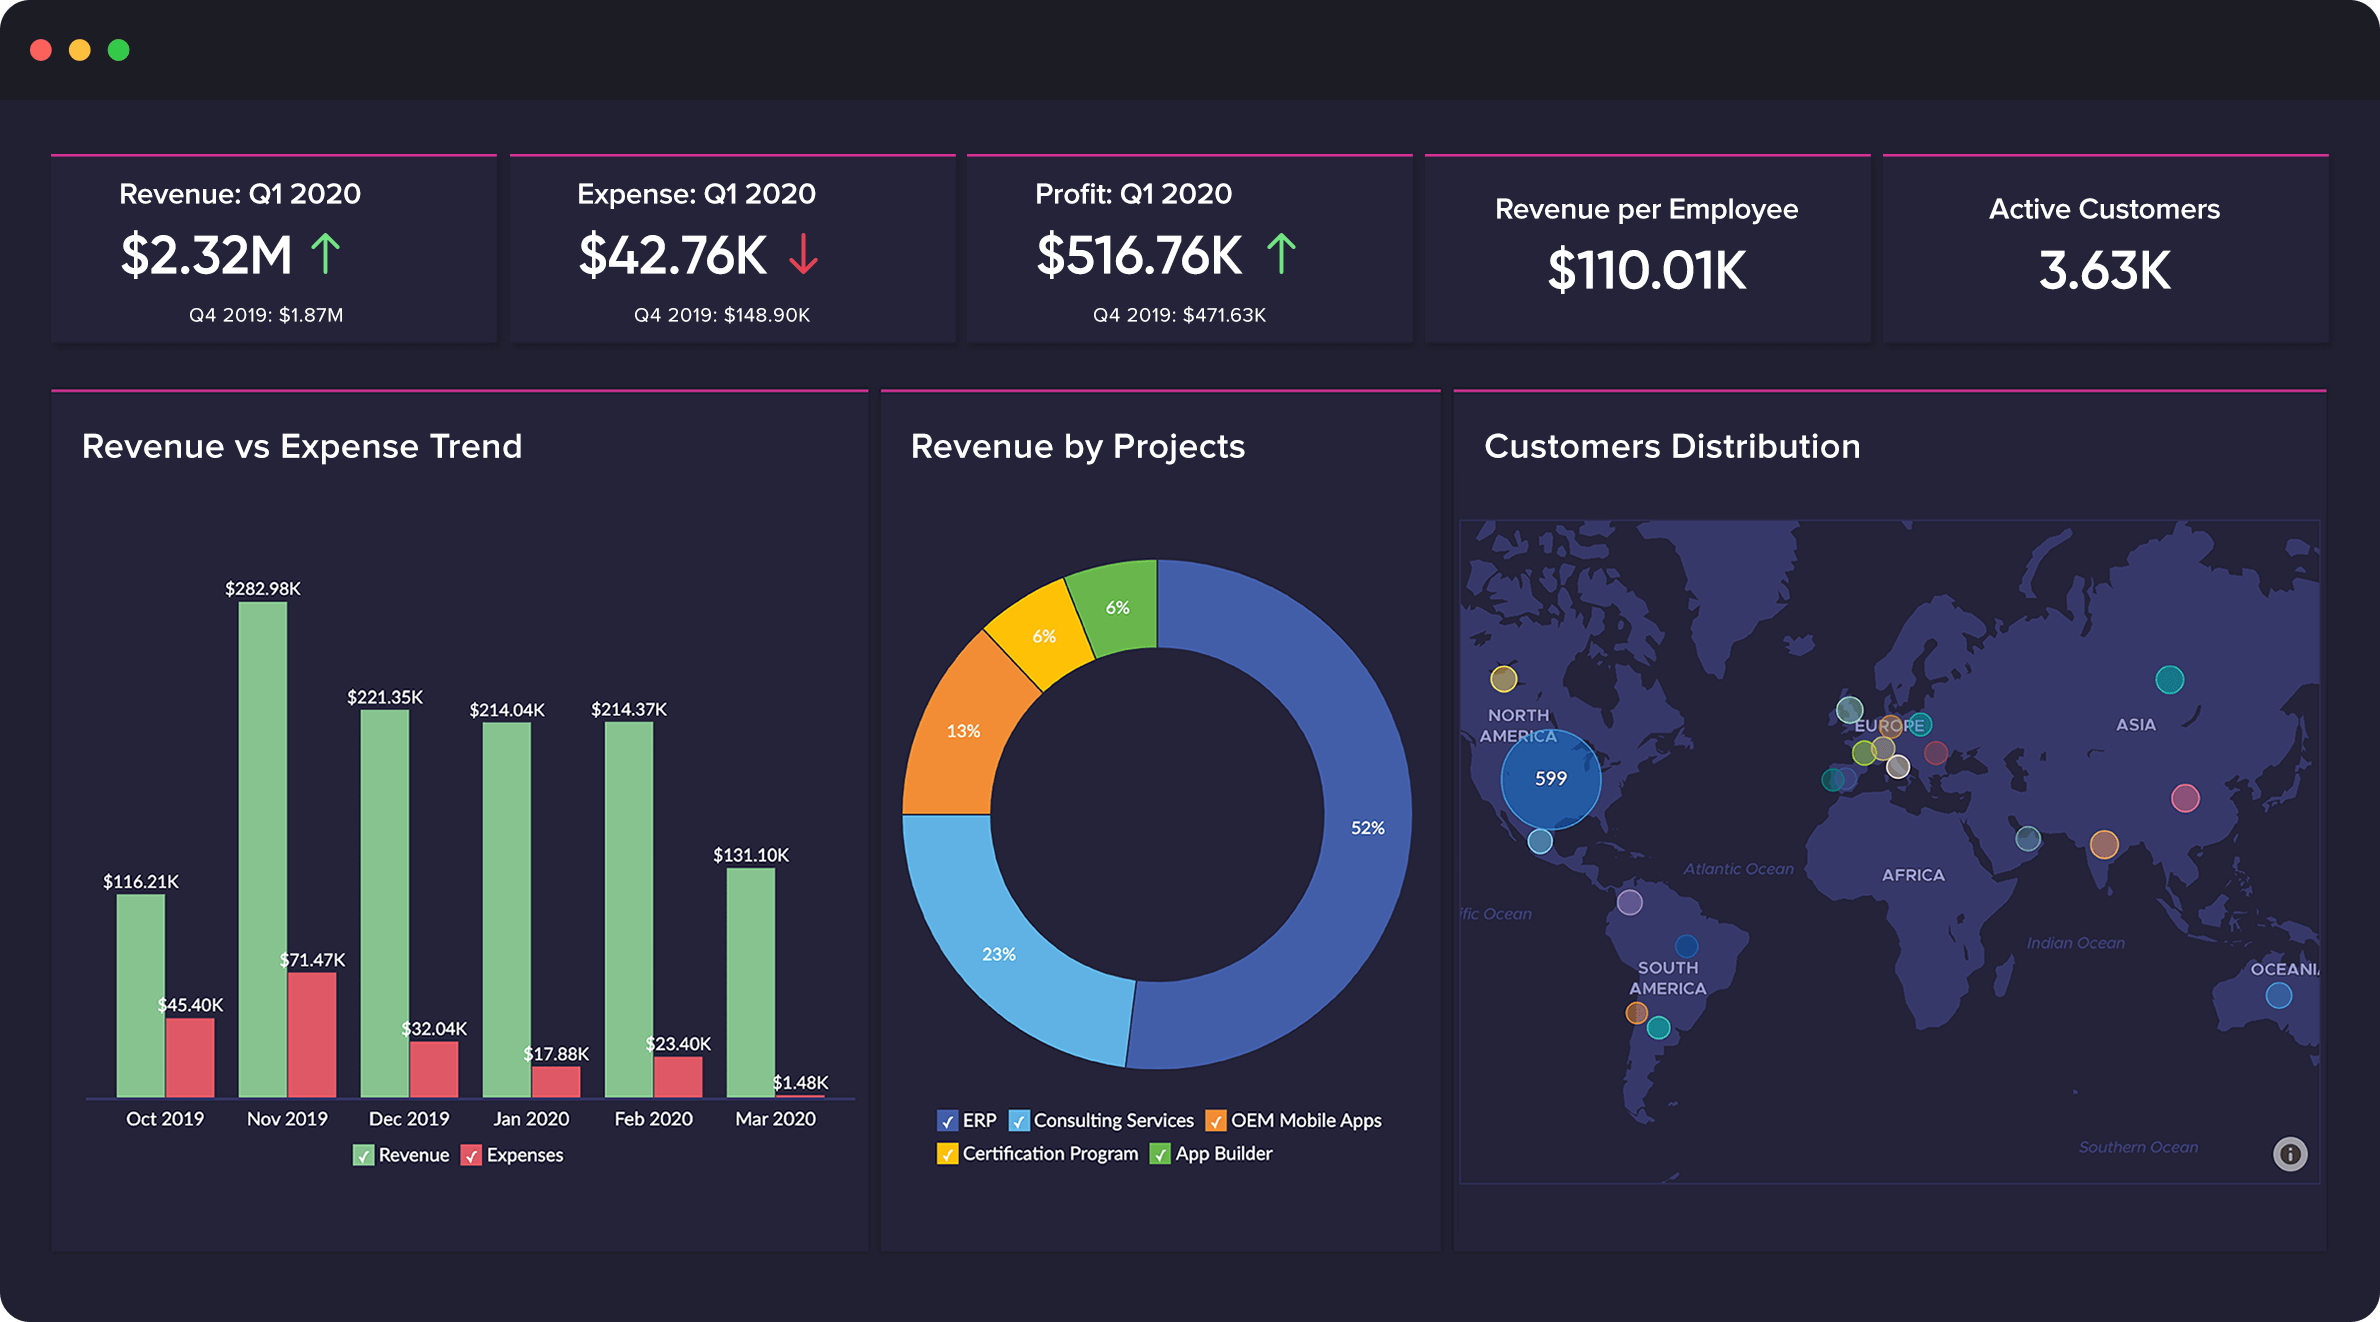
Why data visualization is important?
Good data visualization removes noise from data, highlights useful information, and tells a story. Edward R. Tufte, a pioneer in data visualization says, "Graphical excellence is that which gives to the viewer the greatest number of ideas in the shortest time, with the least ink in the smallest space."
Data visualization software for businesses
In this era of big data, businesses need a versatile data visualization software that would solve all their visualization needs. The effectiveness of any data visualization software lies in the richness of data visualization capabilities that it offers. A data visualization software which offers this excellence will become a vital component of any business and its processes.
Broad goals of data visualization
In a business environment, the speed at which decisions are made is key. It shouldn't take too long to find answers for known questions and indicators. Yet, while dealing with unknown scenarios, there should be sufficient scope to explore the available data in less time-consuming ways.
Hence, for any data visualization tool, the two major goals are:
Explanation: Visuals that provide users with relevant information for standard, day-to-day needs (ex: volume of sales in a day across regions)
Exploration: Offering a multi-dimensional view of a data-set for users to explore, ask questions as they reflect, and uncover insights along the way (e.g., Performance of a business measured by different parameters over a given time period)

Components of data visualization
Human minds process visuals at an incredibly high speed, and the same also applies to data visualizations. The reason is that it takes less than half a second for the eye and the brain to grasp what is called the pre-attentive visual properties of an image—the color, form, spatial positioning and movement that makes up a data visualization.
A wide range of visualizations can be created with these building components. They include:
- Time-series visualizations, such as line charts and area charts which depict how a variable, or multiple variables, change over time.
- Ranking & comparison of different types of bar-charts, like horizontal/vertical, grouped, and stacked.
- Part-to-whole views of data on a percentage basis using pie charts.
- Correlation between two or three variables can be effectively understood using scatter plots and bubble charts.
- Geo mapping visualizations like choropleth—a shaded or pattern-filled map—are useful when it's necessary to compare or segment a data set by geographic region.
Real-time business use cases
Faster decision-making in business can be better facilitated by precisely offering the context needed for stakeholders. Dashboards achieve this by collating data visualizations that measure and track essential KPIs. The effectiveness of a dashboard though, lies in offering the latest available data.
Choosing appropriate data visualizations for business can be made based on 1) the type of users, 2) the level of detail they're looking for, and 3) their frequency of usage. Data visualizations have their specific utilities in different disciplines and industries. Here are just a few examples:
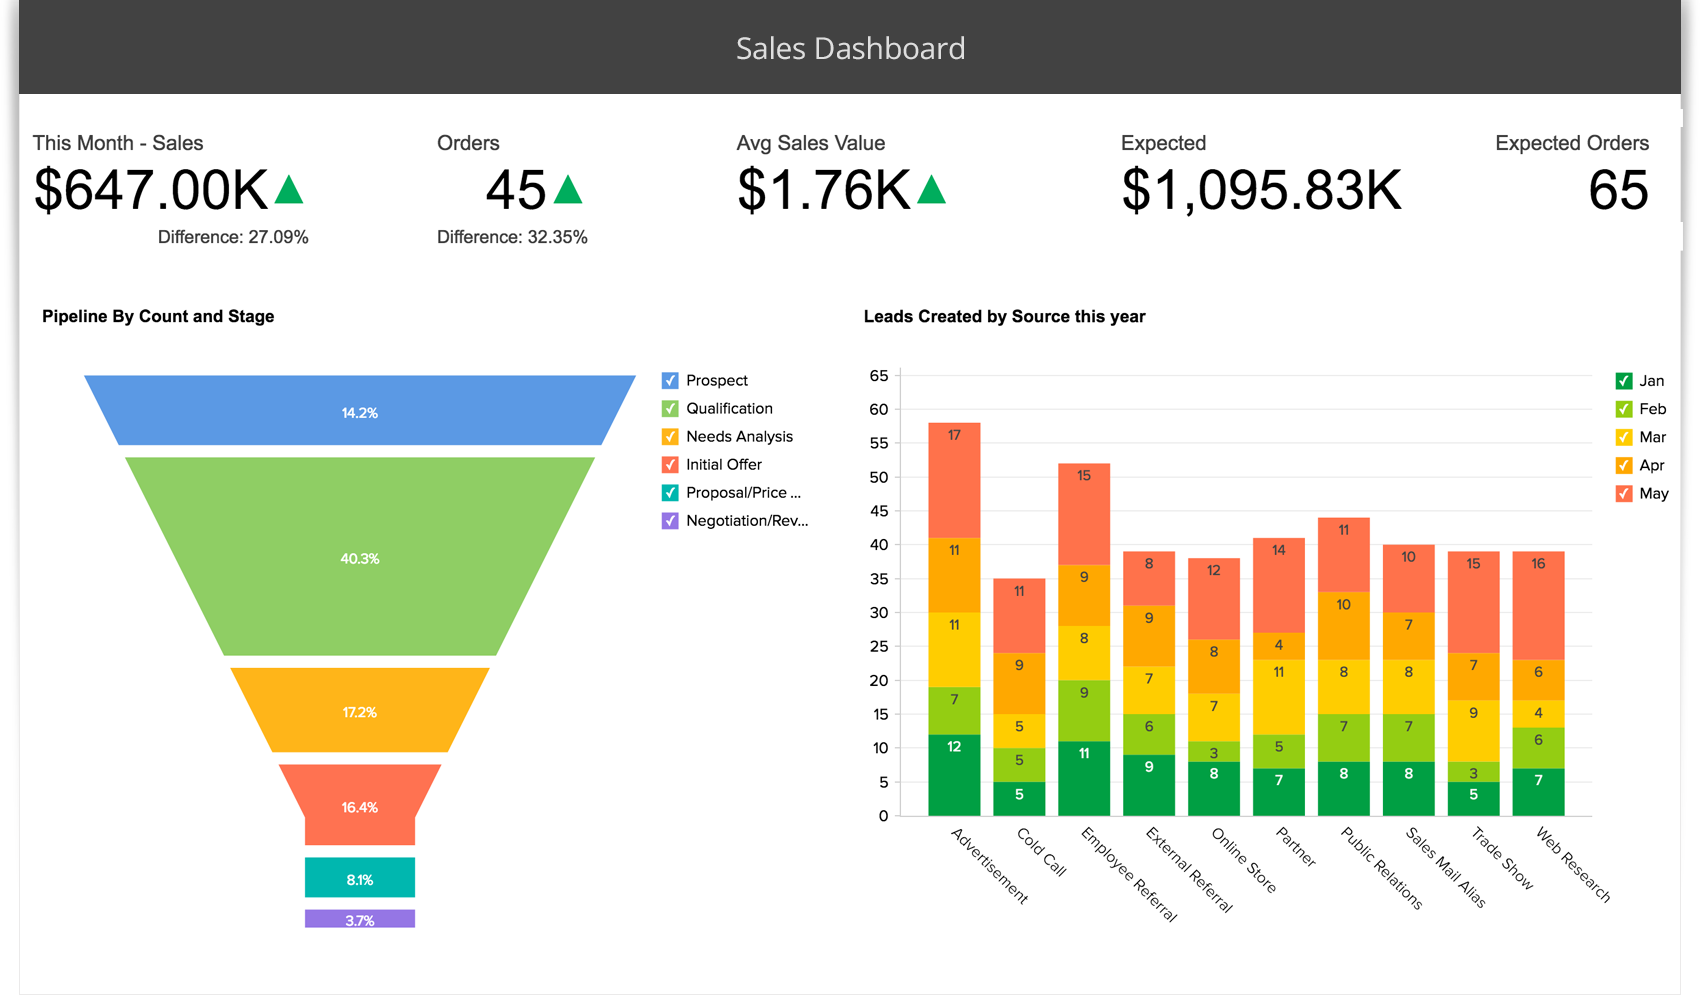
- Sales
- Marketing
- Finance
Sales
Visualizations help in evaluating the effectiveness of different channels in achieving the larger sales objectives by communicating data aggregated from multiple tools and sources. Learn more about sales data visualization.
Marketing
Track the impact of your marketing initiatives in terms of engagement and conversion-rates using insightful visualisations. They can also be easily shared across the stakeholders involved for their up-to-date awareness. Learn more about marketing data visualization.

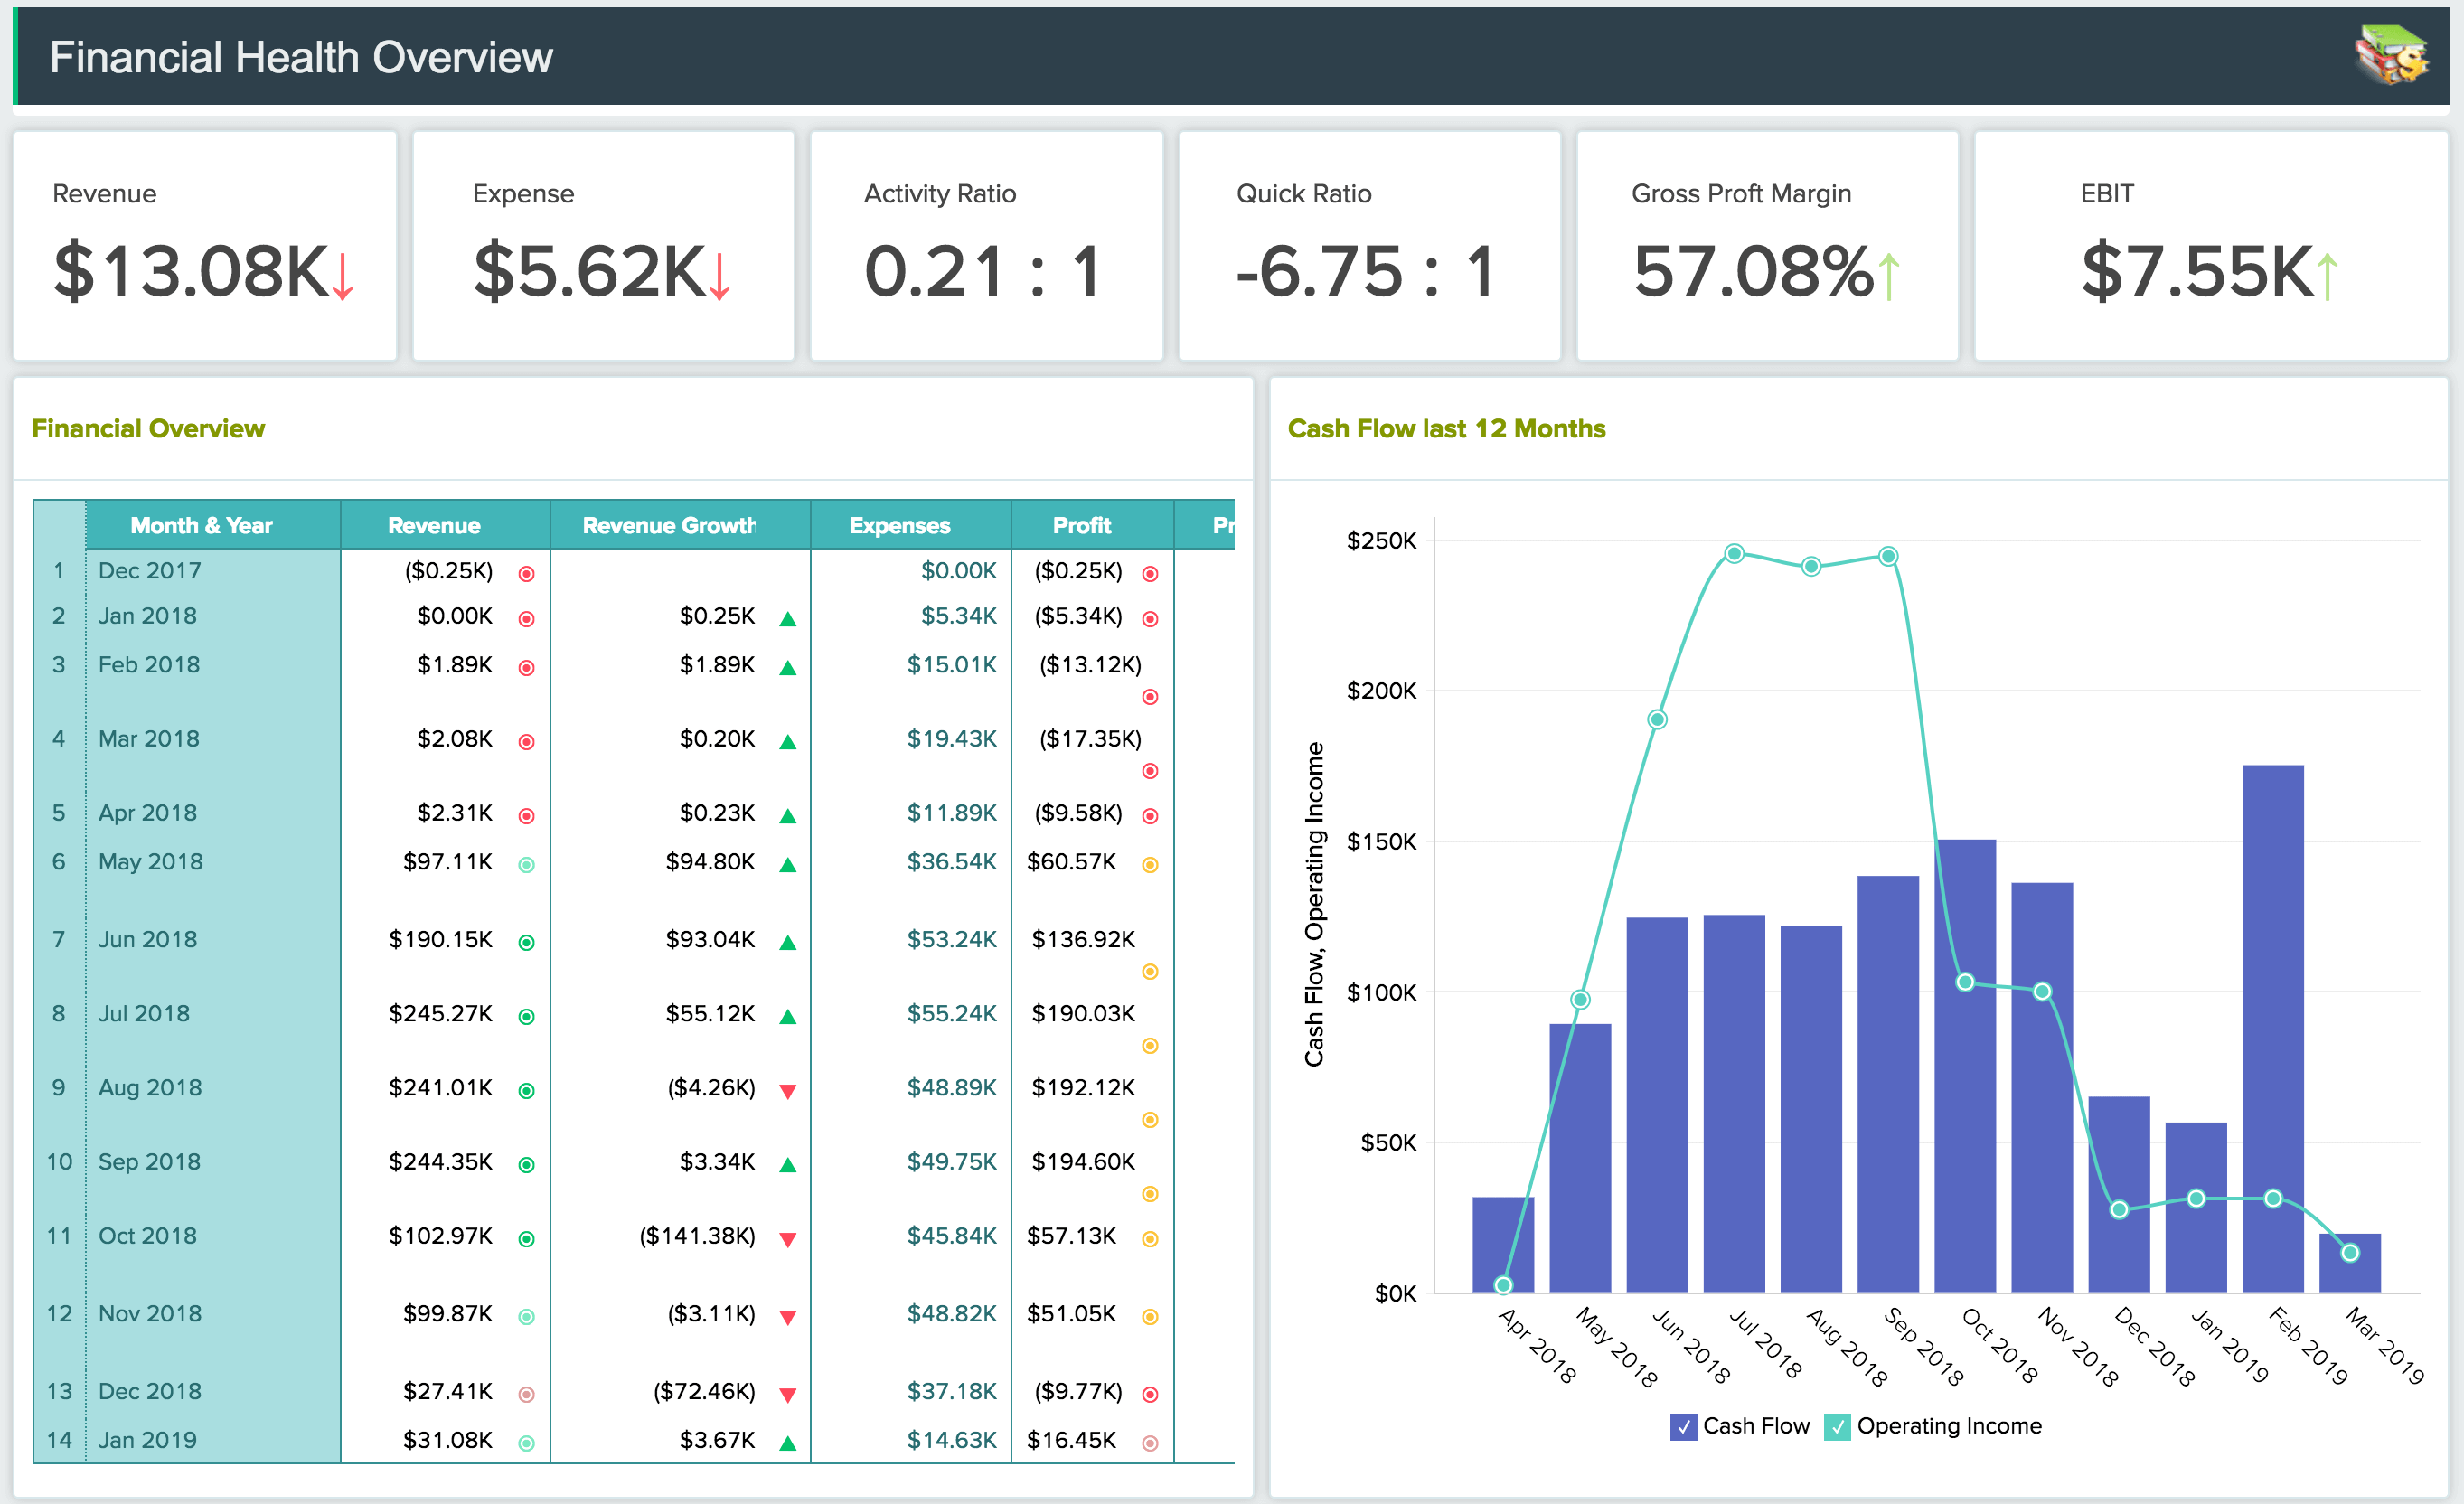
Finance
The enumeration and presentation of in-depth financial data enables better tracking and forecasting of organizational performance, and readiness to withstand uncertainties. It also saves a substantial amount of data preparation time that could be better utilized for other high-value activities. Learn more about financial data visualization.
Ready to start with Zoho Analytics?
A cloud BI pioneer for over a decade, Zoho Analytics is now used by more than 10 million business users, and 100,000 businesses in 120+ countries around the world.
Want to join us? Get started now!
Sign up for free